Cooperatives Europe · 2022 – now

Cooperatives Europe website rebuild

A complete rebuild of coopseurope.coop in 2022: new structure, new back end and a move from Drupal to WordPress, while keeping the content, the site's history in Google and its search rankings. In the first full year that followed, real visitors grew by 69%.

Wireframes to launchDrupal to WordPress migrationInformation architectureSEO preservationContentAnalytics
Web
Cooperatives Europe website rebuild
+69%real visitors per year, 2023 to 2024
+16%returning visitors, 2024 to 2025
+10%homepage views compared with the old site

The challenge

The old Drupal website reflected the same rigid identity as the brand. Its structure had grown over the years, it was hard for members and partners to navigate, and it was difficult to maintain. At the same time it carried years of content and search rankings that the organisation could not afford to lose.

What I did

We rebuilt the site from the ground up: a new structure, a new back end and a move from Drupal to WordPress. I was involved in every step, from research and wireframes to the finished site, doing the research together with the team. A key part of the job was protecting the site's footprint in Google during the move: carrying over content, keeping important pages findable and limiting the loss of search rankings. Since launch I have managed the site's content, structure and SEO, and used Google Analytics and Hotjar to keep improving it.

Building on what worked

The data showed that one page, Share the Benefits, drew almost a third of all visits on the old site. I used that insight to build evergreen, search-friendly pages on related questions, such as Cooperative values and principles and What is the cooperative movement, and added pages that were missing: thematic pages on youth, education, gender equality and the triple transition, the Young European Cooperators Network, Contact and Statutes. I also linked the site together far more, with "learn more" and "more information" links that lead visitors from one page to the next, and made it more visual, with clear, responsive buttons and simple navigation.

The result

The proof is in the numbers below. Pages with a clear purpose for members and partners, such as news, events, governance and our approach, draw more views than on the old site. The new explainer pages took over from the single page the old site depended on, and real visitor numbers rose sharply in the new site's first full year and have held since, with more people coming back every year.
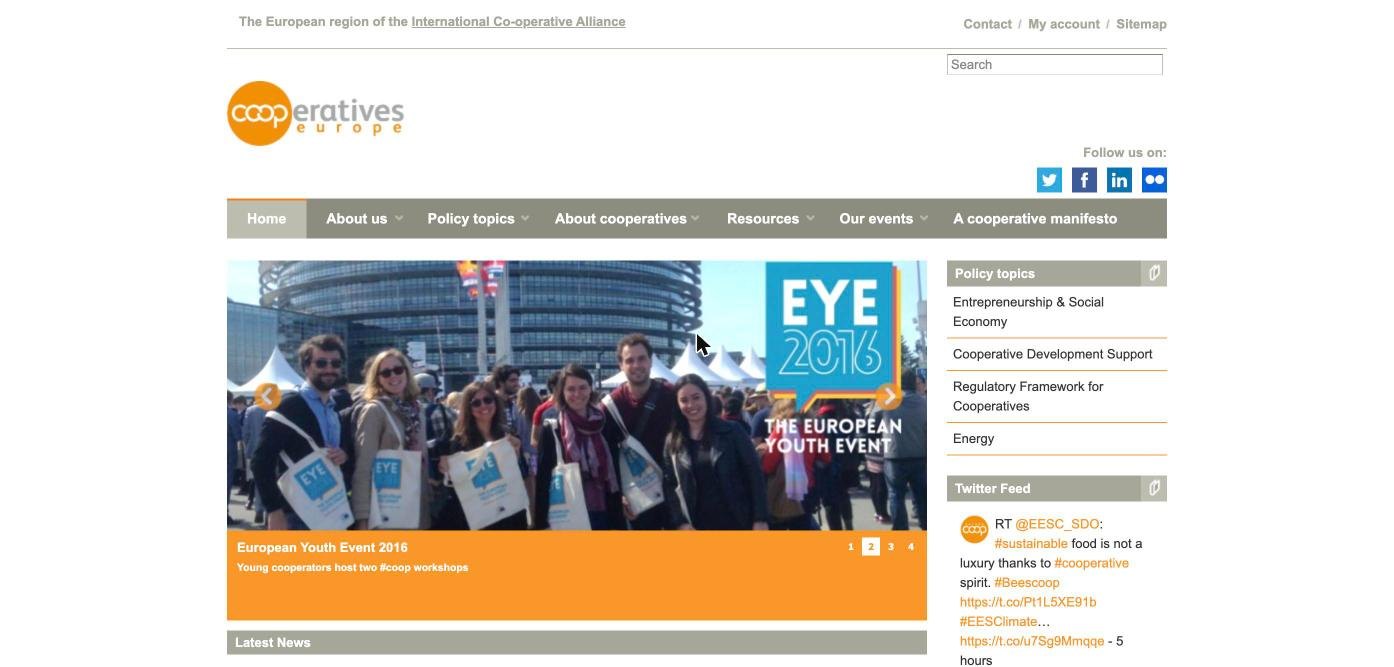
Before and after

coopseurope.coop before 2022
coopseurope.coop today
Illustration until the real screenshots are addedBeforeAfter

Reading the numbers: the caveats

Comparing website statistics across these years is not straightforward, and knowing why is part of the job.

Two different measuring tools

Google replaced Universal Analytics with Google Analytics 4 in 2023. The two count sessions, users and time on page in different ways, so old and new figures show direction, not exact change.

Bots and crawlers

Since 2025 automated traffic has flooded the site: 358,000 two-second visits to one search page in 2025 alone. Left in, it would hide every real trend, so I filter it out and report on human visitors.

AI answers in search

Search engines and AI assistants now answer simple questions directly, so fewer people click through for basics. This is a likely reason why general explainers such as Share the Benefits get fewer visits than before, while specific, organisation-led pages hold up or grow. AI assistants now also send a small but growing number of visitors.

Shorter, more focused visits

Engagement times are lower across the web as visitors scan, arrive from AI tools or leave once they have their answer. A short visit is not automatically a failed one.

What I changed, page by page

Views per year for the main pages I rebuilt. The old figure is the yearly average from March 2019 to March 2022 (Universal Analytics). The new figures come from Google Analytics 4; 2026 is projected from January to 21 October. Read them with the caveats above.

Page and changeOld site, per year202420252026*TrendOld site to 2025
HomepageRebuilt, with clearer navigation and buttons into the rest of the site13,15412,82814,47114,579+10%
NewsUpdated5809231,6071,839+177%
EventsUpdated8918461,7462,145+96%
About us: Activities → Our approachRenamed and reworked6313181,3341,372+111%
GovernanceUpdated7281,059999857+37%
Our membersFilters by country and member type, search, and a listing and map view2,3722,3402,1951,569stable
Our team → Our staffRenamed and updated1,3621,3141,3431,400stable

* Projected from 1 January to 21 October 2026.

New pages I added

Pages that did not exist on the old site. Views per year.

202420252026, projected

New thematic pages

202420252026, projected

Together, the new pages above drew about 4,300 views in 2025, traffic that simply did not exist on the old site.

The numbers

Real visitors since the new site

Google Analytics 4, from 24 March 2023.

+69%real visitors per year, 2023 to 2024
2×returning visitors per year, 2023 to 2024
+16%more returning visitors again in 2025
Human visitors per yearUsers from search, referral, social and other sources. Direct traffic excluded because of bot activity.
Returning visitorsPeople who came back more than once in the year. Direct traffic excluded.
Visitors from Google searchOrganic search, the main way people find the site.

GA4 only started counting on 24 March 2023, so the 2023 bar shows the yearly pace from those nine months, not the raw total. 2026 is projected the same way from 1 January to 21 October. Since 2025 bots have sent hundreds of thousands of two-second visits to one search page (358,000 in 2025 alone). They all arrive as direct traffic, so these charts leave direct traffic out to show real people.

* Yearly pace for a partial year.